Image Compression Tests
Below are some studies and conclusions conducted by the FOG community's users.
devinR
This isn’t strictly a tutorial, but I am sharing info, so here we go! I loved the work by Ch3i here: https://forums.fogproject.org/topic/4948/compression-tests, but I wanted to know a bit more. Yesterday I spent more time than I should tell my boss just capturing the same image with different compression ratings. Here’s a brief table of contents:
Questions
- Data
- Methodology\Specs
- Conclusions
- Future work
So without further delay, lets go!
Questions
Here are some questions that I plan to answer:
- How much extra space does each compression level take (compared to max 9)?
- How long does each compression level take to capture?
- How long does each compression level take to deploy?
- What is best for my environment?
Data
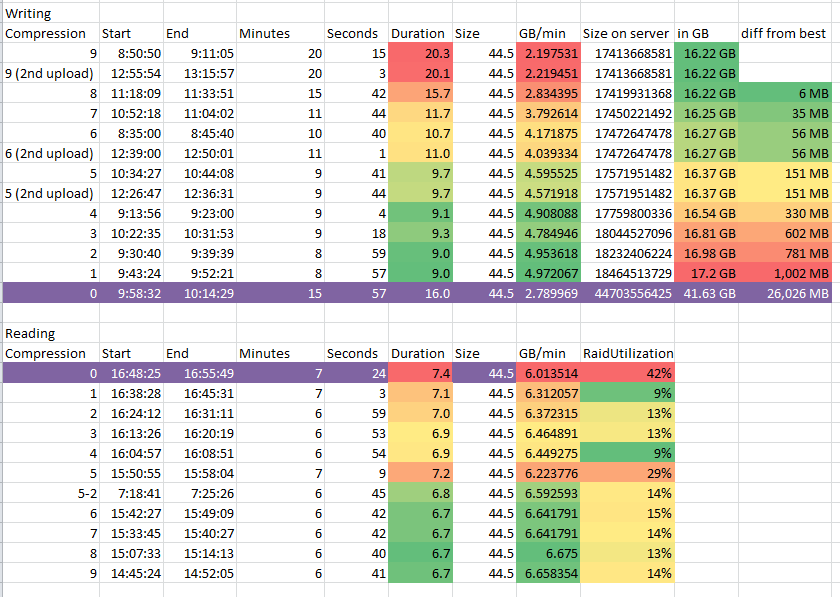
Picture of my data, yay!
Methodology\Specs
FOG server (1.2.0) is a dual core 2.8GHz dell Optiplex 380 (2008ish) with Debian 7 (Wheezy). It has 1x7200RPM HDD (80GB) as the linux root file system with a pair of WD “Black” 1TB 7200RPM HDDs in a linux software raid mirror mounted on /images. It also acts as our DHCP server for known computers, unknown devices like phones or tablets, and VoIP phones (between 350 and 400 devices during the business day). Connected to netgear unmanaged Gig switch with a single link.
FOG client is a new dell Optiplex 3020 with the dell image (with the first 2 partitions removed. Only a single partition (sda3) is being captured\deployed. This client has something weird with for server, so all captures and deploys cause the client to take like 80s with a blinking cursor before it fully loads and continues. This makes all of my times show longer and all of my speeds to be lower than actually observed. Connected to same netgear unmanaged Gig switch with a single link.
All images were sent with unicast deploy tasks and capture were done with a Single disk multi partition fixed size option set.
A few times I had to run the capture twice because I didn’t save the image the first time I captured. This is why there are two entries for captures. All captures were completed before any deployments to make sure that we didn’t get a chain effect of errors from 1 compression to another.
The raid utilization was determined by polling the raid hard drives active time every second for a duration of 100 seconds during the deploy. This was accomplished with the command “iostat -dx /dev/sdb /dev/sdc 1 100 > Compression5.log” I then took these 100 entries and averaged them to produce the snapshot of about 1/4th of the total deployment time for the image.
Conclusions
- There are bigger factors for deployment time than compression. I was concerned about why compress 5 had such bad deploy performance. I ran the test again and got much better results. It just seems that the FOG server was busier, or our network was under heavy load, causing many packet failures, or something weird. I don’t know what. This makes believe that while greener is better for deployment duration, at any time, any of the higher compression images can have worse time to deployment times than a lower compression.
- Capture time can safely be reduced with minimal impact on image size. Even if it is just to compression 8, time goes to 75% of compression 9. Going to compression 7 further lowers it to about 60% of the time with a .2% increase in stored image size.
- I care about deployment time, so any compression level above 1 will give me a good deployment time. I also like my capture to not take forever, so going forward, my compression level is getting set to 7.
Future work
- Same deployment tests but multicasting
- Same deployment tests but to multiple hosts at once (4 or 5)
- Other?
ch3i
I have try some compression level, below results :
Host configuration :
Core I5 12 Go RAM Ethernet : Giga LAN Configuration :
Ethernet : Giga Deploy method : unicast
Installation :
Single boot Windows 7 Size : 87 Go Compression : 0
-rwxrwxrwx 1 root root 512 févr. 10 10:32 d1.mbr -rwxrwxrwx 1 root root 0 févr. 10 10:32 d1.original.swapuuids -rwxrwxrwx 1 root root 25363450 févr. 10 10:32 d1p1.img -rwxrwxrwx 1 root root 86580172755 févr. 10 10:53 d1p2.img -rwxrwxrwx 1 root root 171142723 févr. 10 10:54 d1p3.img
Tasks :
Capture : not tested Donwload : ~3G/Min - ~29 mins Compression : 5 ( The winner :p )
-rwxrwxrwx 1 root root 512 mai 13 10:45 d1.mbr -rwxrwxrwx 1 root root 0 mai 13 10:45 d1.original.swapuuids -rwxrwxrwx 1 root root 8544045 mai 13 10:45 d1p1.img -rwxrwxrwx 1 root root 40054036052 mai 13 11:03 d1p2.img -rwxrwxrwx 1 root root 3459293 mai 13 11:04 d1p3.img
Tasks :
Capture : ~4.9G/Min - ~17 mins Donwload : ~6.4G/Min - ~13mins Compression : 9
-rwxrwxrwx 1 root root 512 mai 13 11:26 d1.mbr -rwxrwxrwx 1 root root 0 mai 13 11:26 d1.original.swapuuids -rwxrwxrwx 1 root root 8471371 mai 13 11:26 d1p1.img -rwxrwxrwx 1 root root 39740659244 mai 13 12:10 d1p2.img -rwxrwxrwx 1 root root 3035522 mai 13 12:10 d1p3.img
Tasks :
Capture : ~1.9G/Min - ~43mins Donwload : ~6.9G/Min - ~12mins
